South Carolina Health at a Glance: Cross-Cutting
Our next installment of the 2018 Live Healthy State Health Assessment covers cross-cutting. Because the document is 346 pages, we will summarize each section. Check out our previous posts: overview of the report, South Carolina demographics, and leading causes of death and hospitalization. Data is analyzed from 2010-2016.
Cross-cutting analyzes homelessness, income inequality, concentrated disadvantage, crime, incarceration, transportation, safe neighborhoods, and adverse childhood experiences.
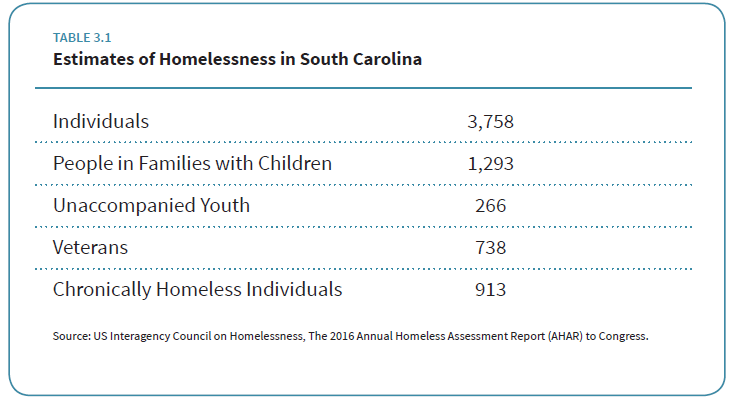
Homelessness
Although the rate of homelessness in South Carolina was less than the rate in the United States in 2016, it was higher in 2016 than it was in 2010 (96.5 in 2010 compared to 101.8 in 2016 per 100,000). More individuals (3,758) were homeless than people in families with children (1,293).
Income Inequality
Income inequality affects health, poverty, crime, violence, and more. Counties in the Pee Dee region of the state, such as Williamsburg, Geogetown, Marion, and Clarendon, had the highest rates of income inequality.
Concentrated Disadvantage
Concentrated disadvantage is comprised of five United State Census variables:
1. Percent of individuals below the poverty line
2. Percent of individuals on public assistance
3. Percent of female-headed households
4. Percent of unemployed individuals
5. Percent of households with individuals less than 18 years of age
These variables may help identify resource-poor areas that have barriers to heath care, education and social services, employment, and healthy foods. In some counties, more than 50% of the census tracts were determined to have a high level of concentrated disadvantage (from 2011-2015). The areas of high concentrated disadvantage in South Carolina characteristically are also rural and of low-income, and with a higher proportion of minorities compared to areas of lower concentrated disadvantage. Some counties with high levels of concentrated disadvantage include: Lee, , Dillion, Marion, Allendale, and Marlboro.
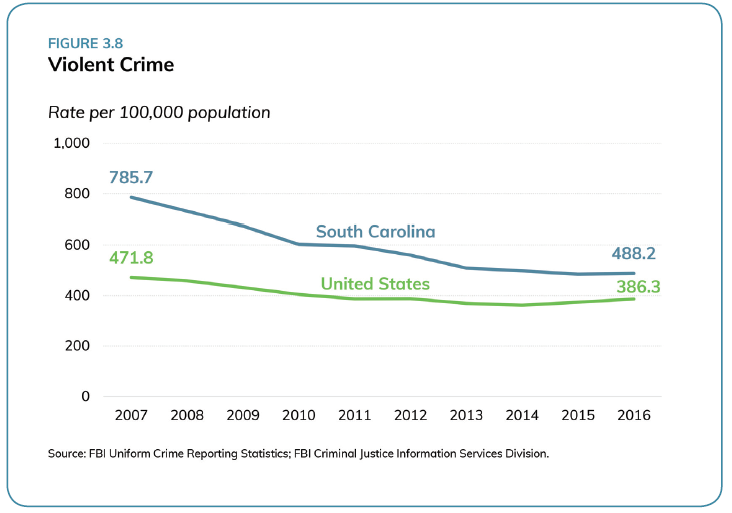
Crime
Factors such as alcohol and drug use, demographics, social and economic inequality, and the availability of firearms can impact the incidence of crime. Although there was a decline in violence crime from 2007-2016 in South Carolina, the violent crime rate was higher than the national rate. Property crime also saw a decrease over the decade, but was still higher than the national rate.
Incarceration
South Carolina is the 2nd lowest incarcerated state in the Southeastern region with a rate of 414 (per 100,000 population).
In South Carolina:
- Incarcerated Inmates, by Gender: 93% Men and 7% Women
- Incarcerated Inmates, by Race: 60% Black and 37% White
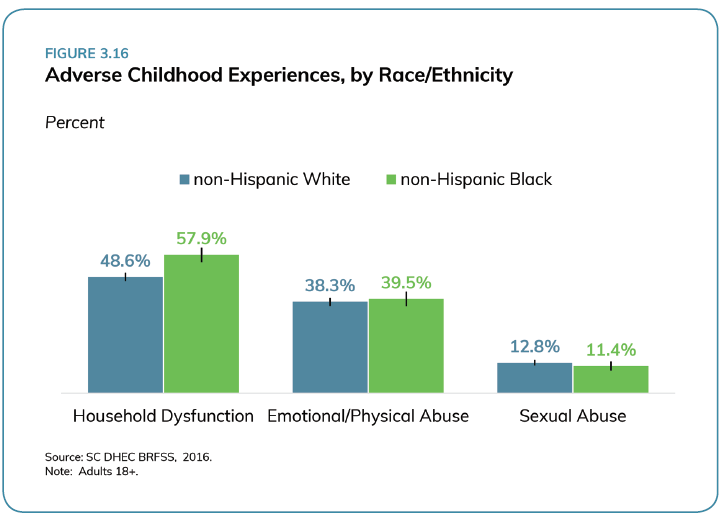
Adverse Childhood Experiences
Adverse childhood experiences (ACEs) include three broad categories:
- Household dysfunction (i.e. violence, substance abuse, mental illness, parental separation)
- Emotional or physical abuse (i.e. excessive profanity, violence, and/or insults toward a child)
- Sexual abuse (i.e. a person at least five years old who has ever touched a child in a sexual way, tried to make the child touch their body in a sexual way, or attempted physical intercourse with the child)
More women reportedly suffered from household dysfunction, emotional/physical abuse, and sexual abuse than men. Non-Hispanic Black adults reported household dysfunction during childhood more than non-Hispanic Whites. There was no significant difference between non-Hispanic Blacks and non-Hispanic Whites regarding emotional/physical abuse and sexual abuse.
For more demographics, charts, and graphs about every Cross-Cutting section, view the full report.