Updated March 24, 2023
Ambient Air Standards
Ambient air is defined in the Clean Air Act as “that portion of the atmosphere, external to buildings, to which the general public has access.”
Areas owned or controlled by a source where the facility employs measures, including fences and physical barriers, to preclude public access are not ambient air.
There are six criteria pollutants listed in the Clean Air Act (CAA) for which the EPA was required to set National Ambient Air Quality Standards (NAAQS) to protect public health and the environment. Those pollutants for which criteria were set are:
- Carbon Monoxide (CO)
- Nitrogen Dioxide (NO2)
- Sulfur Dioxide (SO2)
- Lead (Pb)
- ground-level Ozone (O3)
- particulate matter (PM)
The CAA directed the EPA Administrator to set criteria for air pollutants that “...could cause or contribute to air pollution that that may reasonably be anticipated to endanger public health or welfare.” These six pollutants were named because they were overwhelmingly imposing the greatest risk on the most people and were emitted by a large range of sources.
Most of the pollutants are associated with fuel burning.
When you hear discussion of 'attainment' or 'nonattainment’, such discussion refers to whether an area meets (attains) or doesn't meet the NAAQS. All areas of South Carolina currently meet all the NAAQS.
The National Ambient Air Quality Standards (NAAQS) are set after a public process that takes approximately five years to complete. The most recent studies related to health effects and impacts on the environment of the pollutant are compiled, reviewed, and distilled in an Integrated Science Assessment (ISA). From the ISA, the EPA assembles a Risk and Exposure Assessment and a Policy Assessment. Scientific review during the development of these documents is thorough and extensive. Drafts of all documents are reviewed by a select group of air and health experts and the public has an opportunity to comment on them. The EPA Administrator uses these documents and advice of an Advisory Committee to propose retention or revision of the standard. The proposal is provided for public comment and a final rule(standard) is published.
DHEC does the required ambient air monitoring and data reporting to EPA for South Carolina, the Catawba Indian Nation (CIN) monitors pollution in the Nation, and North Carolina Department of Environmental Quality and Mecklenburg County Air Quality monitor and report air quality for North Carolina. DHEC and the Catawbas coordinate to assure that monitoring requirements and needs are met for South Carolina.
Nationwide, the vast majority of ambient air monitoring for the criteria pollutants is done by State, local and tribal governments. All agencies must develop and use approved methods and instruments and report their data to a common National database. This requirement assures that data quality is consistent, and measurements can be compared locally, regionally, and nationally.
Near real time ambient air data is available for Ozone and fine particulate on the internet at AirNow.gov. DHEC and the Catawba Indian Nation (CIN) provide data to this site for processing and display each hour.
DHEC and CIN store and make available all ambient air monitoring data in the National database – The Air Quality System (AQS). Summaries and detailed data are available from AQS through the EPA’s Air Quality Data page.
DHEC has been delegated authority by the EPA to implement the Air Program, including the National Ambient Air Quality Standards. The NAAQS have been adopted into State Regulation. (Regulation 61-62.5, Standard No 2). South Carolina also has set a Maximum Allowable Average Concentration for over 250 Toxic Air Pollutants. (Regulation 61-62.5, Standard No 8).
Air emissions are the material that is released (emitted) into the air as a gas or aerosol (solid or liquid particles) by human activity like industry and transportation. There are also natural emissions from plants and trees, waterbodies and natural events. Emissions can come from a stack or vent (a point source) from a place like a road, field or pond (an Area source) or vehicles (a mobile source). Emissions can travel long distances, change in the atmosphere through chemical reactions, and be removed over time by gravity settling and precipitation.
Facility air permits and vehicle pollution control requirements limit, but do not eliminate, air emissions from human activity.
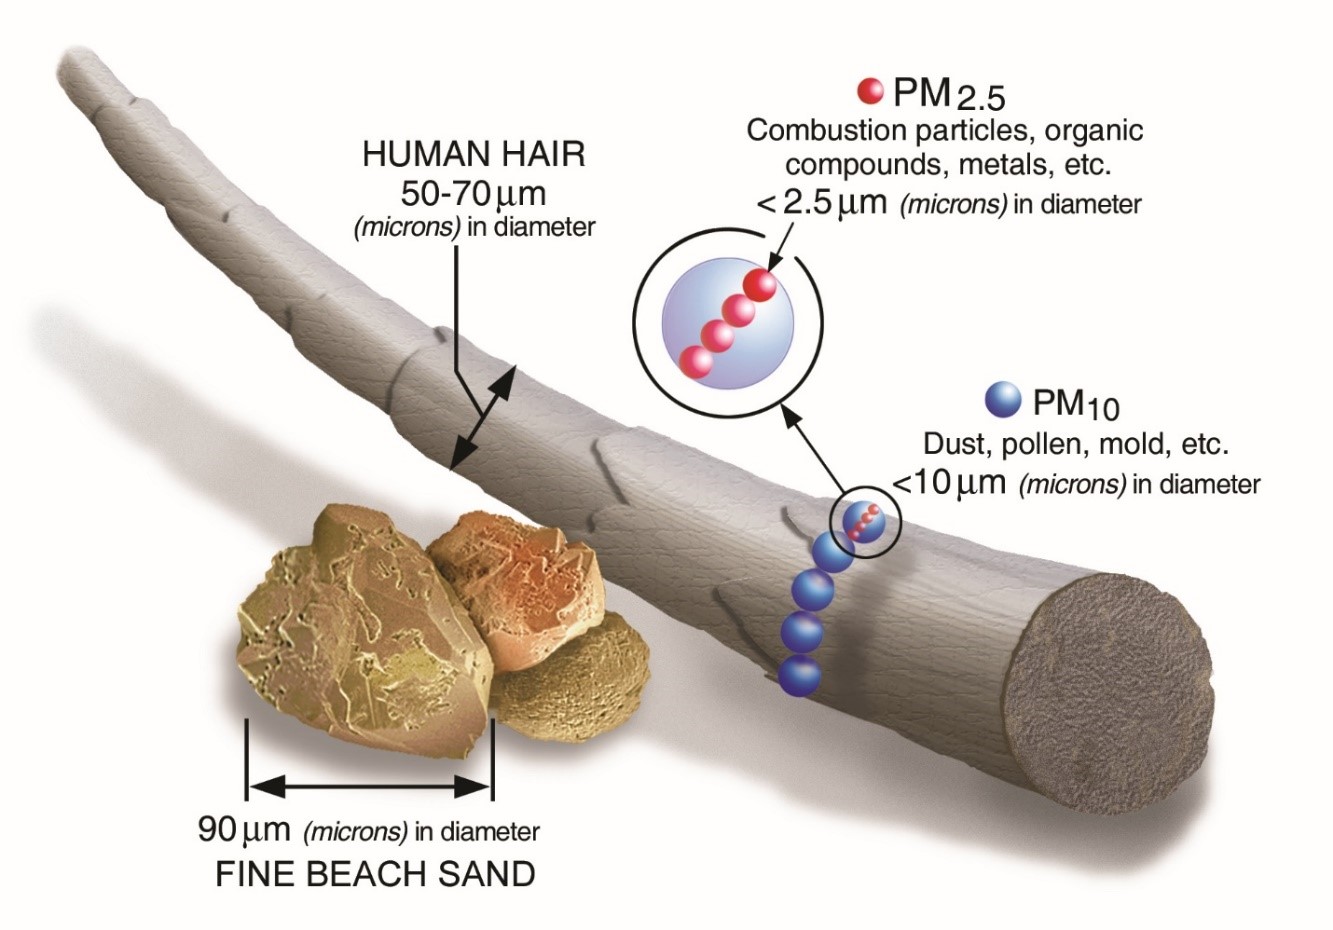
Particulate Matter (PM) is the term for a mixture of solid particles and liquid droplets found in the air. Some particles, such as dust, dirt, soot, or smoke, are large or dark enough to be seen with the naked eye. Others are so small they can only be detected using an electron microscope.
Particulate Matter is a good example of how air standards have changed to meet improved understanding of health effects.
The PM standard started as Total Suspended Particulate in 1971, added PM10 (particulate less than 10 microns) in 1987 and in 1996 moved to PM2.5 (particulate less than 2.5 microns) in 1997. As the impact of fine particulate getting deep into the lungs was better understood the standards changed to better protect public health.
PM2.5 refers to aerosols (particles and liquid droplets) that are smaller than 2.5 microns s in size. The haze seen in the Smokey Mountains or when looking along a beach is caused by the presence of these very small aerosols.
A small portion of fine particulate are emitted directly from a source, such as construction sites, unpaved roads, fields, smokestacks, or fires. Combustion source fine PM may be emitted as a particle (filterable) or as a gas that condenses to a particle as it cools (condensable).
Rather than being emitted directly from a source, most fine particles form in the atmosphere from complex reactions of chemicals such as sulfur dioxide and nitrogen oxides, which are pollutants emitted from power plants, industries, and automobiles.
Weather and Air Quality
Local winds and weather conditions are the primary determinants of what areas may be impacted by emissions from a source. Areas downwind of a source will be impacted, but there are other factors that can affect ground level concentrations. Such factors include:
- Wind speed – Generally, pollutants disperse more quickly when the wind speed is higher which lowers the concentrations downwind at ground level. Areas immediately around a source may see higher concentrations at any time during periods of light and variable winds.
- Topography - Wind speed, varied ground heights, and land use (fields, forest or buildings) can increase turbulence and dispersion. During very light winds or when vertical dispersion is limited, the pollutants may be partially redirected into river valleys and lower elevation areas.
- Temperature - Turbulence caused by the wind passing over the surface also mixes pollutants vertically. When that vertical mixing is limited, pollution can become trapped closer to the ground. This happens most often when there is an inversion of the temperature profile (i.e., cold air is trapped by a warmer air layer above) and is most likely to happen in the cooler months during cool or cold, calm nights. The trapped pollutants may be more noticeable than usual during overnight through morning hours when the inversion is strongest. As the sun warms the ground in the morning, the warmed air near the surface will rise, increasing the volume of air into which the pollutants can disperse.
- Moisture - A recipe for valley fog (or one that spreads the fog into even the most subtle valleys) consists of mostly clear skies and light winds near the surface during the overnight hours and a moisture source such as a river (or high soil moisture content from recent rains). Fog formation is a common occurrence within the Catawba River basin during the Fall months as nights get longer and temperatures get cooler. A relatively warm river may feed moisture into the colder air right above it. The increased moisture in the colder air then condenses to form water droplets (and possibly fog).
The most authoritative source for current and forecast wind is the National Weather Service(NWS). The Greenville-Spartanburg NWS office prepares forecasts for the area near the New Indy facility. You can get forecasts tailored to your area by going to the Charlotte NWS site (search NWS CLT), clicking on the location of interest on the map where it says “Click Map for Forecast“ to place the forecast area where you want it, and then using the Hourly Weather Forecast found under Additional Resources a little further down the page to look at the detailed forecast for that location for the next several days. A current example centered on the New Indy Facility is available here.
Odor Reports
Odor reports are reviewed daily to inform staff in the area if there is a need to investigate and confirm the reports. The odor reports were instrumental in providing the information to support the Department's investigation. Of the initial reports, selected reports that had a high degree of certainty in time and location were used to establish starting points for back trajectories from different areas and in different weather conditions to help identify the source.
The reports, in conjunction with local meteorology, continue to provide an indicator of source activity and help gage improvement. Daily review of the reports - morning and evening- provide information to inform activity by DHEC Regional staff.
Reports are also reviewed for anomalies. Different or unexpected odor report clusters, for example an unexpected odor description in an unexpected place, is reported to the local agency responsible for investigation to see if there may be a problem or a local source.
Reports that have a resolvable place and time are used to generate the odor reports maps posted on the web page to provide an indication of the distribution of reports and the type of odor reported.
There have been occasions where a cluster of odor reports to Regional Offices have prompted an investigation and response, but none with the volume and duration experienced starting in March 2021. Because of the volume of reports being received, DHEC established a public webpage and an on-line Odor Report Form, which any citizen can access, fill out, and submit electronically to report the location and description of observed odors.
DHEC looks at the time of day that reports are made and the time of day that odors are noticed for patterns and correlation with activities onsite at New Indy. We also use the report information to investigate potential sources other than New Indy.
It is DHEC’s policy to protect all Personally Identifiable Information (PII). If reports are distributed outside the agency in response to a Freedom of Information request, all identifying information (Name, Email address and Street Address) is removed. If a government partner needs parts of the report listing to support investigation and response, any mention of names and email addresses and any street address numbers are removed.
Honesty is the best policy – and provides the best information.
Provide the location and approximate time as exactly as possible. A street address with number is best. Information that may identify an individual (Personally identifying information –PII), including addresses, is not released.
Describe the odor the best you can using the selections. Add a comment, if necessary, to better describe the odor.
Don’t submit reports for neighbors’ addresses unless you are assisting them with a report.
Focus on quality reporting with detailed information – time, location, and odor description - rather than quantity of your reporting.
Please remain civil.
If you have a question, please use the NewIndyQuestions@dhec.sc.gov email address so we can try to provide an answer for everyone in the FAQs.
Modeling
Air quality modeling is a computer representation that simulates the spread (dispersion) of air pollutants after the pollutants are released from a source. The models are run using EPA approved computer software tools that have been demonstrated to provide useable estimates of the distribution and impacts of different pollutants. The model can predict the pollutant concentrations at and beyond a facility fence-line and into the community.
Air quality modeling is used:
- To demonstrate that a source of pollutant emissions will not cause an exceedance of an air quality standard, such as the National Ambient Air Quality Standards (NAAQS).
- To predict where the maximum pollutant concentrations are likely to occur to inform the public and help with placement of ambient monitors.
- To combine emissions from various naturally occurring and human sources (automobiles, factories, airports, etc.) in a region to predict transport and transformation of pollutants in the atmosphere. These models can be used to predict ozone formation and regional haze or to perform ozone or smoke forecasts in a state or across a region.
The information needed to properly set up and run an air dispersion model includes:
- The expected emissions for each source of the pollutant(s) of interest
- The location of each source of the pollutant(s) of interest
- Source parameters for each source. Depending on the type of emissions release, source parameters can include the release height, exit diameter or area, exit velocity of the emissions stream, and temperature of the emissions
- The layout of the facility property, including the location and dimensions of buildings as well as the location of the property boundaries
- A record of meteorological data representative of the weather conditions at the facility and the surrounding terrain that is complete for several years. In South Carolina, data from the closest National Weather Service or Federal Aviation Administration meteorological station is typically representative of the facility location.
- Terrain elevations for the sources, buildings, and modeled receptor locations, usually obtained from the US Geological Survey National Elevation Dataset
The air dispersion modeling submitted by a facility is checked, in detail, by a meteorologist, engineer, or other scientist on our DHEC staff to ensure the modeling was set up properly and that all the modeling inputs, including emissions and other source and facility parameters, were properly entered into the model. The model is then independently run using completely independent meteorology and terrain data to verify the model results. DHEC confirms the predicted pollutant concentrations meet any applicable ambient air quality standards.
If a facility cannot demonstrate using approved models and methods that their emissions will not contribute to a violation of a standard (…cannot ‘pass modeling’), they must reduce predicted emissions sufficiently to meet the standard(s). Changes to the facility or the permit can include altering the stack dimensions, installing air pollution control devices to reduce the emissions, and/or accepting permit restrictions (such as a limit on production rate or hours of operation) to limit the emissions being released from a stack or stacks. If changes cannot be made to reduce the predicted concentrations sufficiently for the model to indicate the standard will not be violated, the air permit cannot be issued.
Because of the many variables involved in executing an air dispersion modeling project, it is not possible to quantify with known certainty the exact accuracy of model predictions. The air quality models are not expected to predict exact concentrations at any specific time. Air quality models use historical weather to incorporate typical and unusual conditions and maximum emissions to approximate worst case and to provide an estimate of where and how great an impact may be. They and are designed, and have been proven, to provide conservative estimates erring on the side of safety. When ambient monitors have been operated in an area that has been modeled it is very rare that the concentrations as high as those predicted by the model have been measured.
Air quality models are continually enhanced as understanding of the mechanisms of dispersion, transport and chemistry improve and the tools to simulate them get more powerful. During air quality model development and whenever there is a revision to the EPA-approved refined model, the model undergoes extensive peer review and testing to compare model results to monitored concentrations obtained through EPA field studies. During the development, testing, and review process, the model formulation is adjusted to avoid underprediction of results. In addition, normal assumptions used during the execution of an individual modeling project also typically work to cause model results to overestimate actual pollutant concentrations. These conservative assumptions normally include the use of conservative (high) emissions estimates using worst-case fuel (etc.), the assumption that equipment operates on a 24 hour/7 day per week schedule, and the assumption that all equipment operates simultaneously at maximum capacity. The air quality model is typically run through a simulation using five consecutive years of actual meteorology collected at a representative National Weather Service, Federal Aviation Administration, or other approved station to ensure the worst-case meteorology is included in the simulation. All these factors work together to provide predicted pollutant concentrations that tend to be consistently higher than what would be found if actual air pollution data were collected at a given facility.
Enforcement
Enforcement is one tool used to help ensure that obligations to safeguard the environment are met through strict adherence to laws, regulations and environmental permits.
The enforcement process starts when potential violations are documented by the Department as the result of a complaint investigation or a routine inspection at a facility.
When a potential violation is documented by the department, the Department will send the alleged responsible party a notice of alleged violation (NOAV) which requires a response addressing the alleged violations . If the alleged responsible party fails to take appropriate action or respond adequately to the Department, the Department may proceed with formal enforcement action beginning with scheduling an enforcement conference to discuss whether the Department should pursue further enforcement action. In some cases, the NOAV is consolidated and sent simultaneously with the Notice of Enforcement Conference. If the alleged violations are substantiated, the parties may mutually agree to a Consent Order or the Department may issue an order requiring compliance with the statute, regulation, or permit that was violated. The order may include a penalty.
The NOAV is the first step in the civil enforcement process. It outlines DHEC’s alleged findings and identifies the law, regulation, or permit requirement DHEC believes was violated. In some cases, the NOAV is consolidated and sent simultaneously with the Notice of Enforcement Conference (NOEC). The consolidated NOAV/NOEC invites the responsible party to attend an enforcement conference to "demonstrate" why the Department should not pursue further enforcement action.
There are different factors considered by DHEC staff when deciding whether to initiate an enforcement action. Most fall within the following:
- the specific type of alleged violation identified may require DHEC to take a formal enforcement action,
- the alleged violation is serious or a threat to public health or the environment, or
- the alleged violation has not been corrected within a reasonable period of time.
The enforcement conference is a voluntary, informal meeting between Department staff and the alleged responsible party.
An enforcement project manager, regional staff, technical support, and other compliance personnel involved with the matter will represent the Department. A staff attorney representing DHEC may be in attendance.
For the alleged responsible party, people who are most familiar with the issues and who have decision-making authority on behalf of the responsible party should plan to attend. The alleged responsible party may choose to have legal counsel present.
The enforcement conference is closed to the public and media per a S.C. Department of Health and Environmental Control approved policy.
The Department holds public hearings as authorized and in accordance with the Pollution Control Act (PCA). There are no provisions in the PCA which provide for a public hearing for enforcement actions or orders.
After the enforcement conference, staff will review the information gathered and determine a reasonable response based upon consideration of the facts. There are four possible outcomes:
- the Department determines that the event is not a violation, and no further action is required,
- the Department determines the violation is properly alleged, but there is justification to resolve the matter without the issuance of an order,
- the Department determines the violation is properly alleged, and the responsible party is given the opportunity to resolve the issue by entering into a Consent Order with the Department; or
- the Department determines the violation is properly alleged and an Administrative (unilateral) Order is issued.
A Consent Order is a legally binding, enforceable document, with terms and conditions agreed upon by the responsible party and the Department. In signing a Consent Order, the responsible party waives their right to an administrative appeal, and the additional time and costs associated with an administrative hearing and other potential court-related costs are avoided.
An Administrative Order is also a legally binding, enforceable document; however the terms and conditions do not have consent or agreement by the responsible party. In the case of an Administrative Order, the responsible party maintains their rights for further appeal of DHEC’s decisions. If an administrative order is appealed, DHEC’s board may hear the appeal, or the order may be heard In the Administrative Law Court or Civil Court, as appropriate.
Civil penalties may be issued for the violation of federal and state environmental laws. The decision to assess a penalty depends upon the type of violation alleged and other factors. Among other factors, civil penalties are intended to deter future noncompliance and eliminate any economic incentive for noncompliance.
The penalty is calculated in accordance with the Department’s Uniform Enforcement Policy. The amount of the civil penalty is designed to reflect the frequency, duration, and severity of the violation(s). Additional factors that may be considered during enforcement penalty assessment are:
- Degree of harm or potential for harm to the public health, safety, or the environment.
- Extend of deviation from the requirements of statute, regulation, or permit.
- Economic Benefit as a result of noncompliance.
- Cost of restoration of the environment or abatement of the environmental harm.
- Past performance record or past history of noncompliance.
- Degree of willfulness or negligence.
For most programs that DHEC administers, penalties are collected in accordance with the SC Pollution Control Act which requires that 50% is paid to the county where the violation occurred and 50% goes to the State’s general fund.
There are a few exceptions. The Environmental Emergency Fund is supported by up to $250,000 per year first from the portion designated for the general fund and several other Acts impose specific distribution for related penalties.
Stack Testing
A stack test is measurement of emissions to the air - sometimes also referred to as a performance or source test. Stack tests utilize EPA-approved test methods and are designed to measure the amount of a specific regulated pollutant, group of pollutants, or surrogates for pollutants being emitted from a stack or other emission point at a stationary source. A source can be an individual piece of equipment like a boiler, a process, or a group of equipment whose emissions are routed to a common emission point or points.
Stack testing gives us pollutant specific emissions data for emissions over a certain period of time. During a stack test, other data relating to the source and/or pollution control device(s), such as stack gas flow, gas temperature, and moisture content, are collected to have the information necessary to evaluate the results of the test. The additional data is used to calculate emissions rates for comparison to different operating conditions, fuels, and processes. This information also enables the Department to relate the measured emissions with the process operating status and conditions during the test.
The stack testing should be representative of normal operations, but also when maximum emissions are expected – maximum production and highest emission fuel - so that the maximum quantity of the pollutant being measured would be produced during the test. It is important to note that most facilities do not routinely operate at these worst-case conditions year-round, so the actual emissions during normal operations are usually less than measured during a stack test
Stack testing frequency is usually determined by the state or federal regulatory requirements relevant to the source being tested. DHEC may require a specific stack testing frequency or additional testing for a source as a condition of an air permit or through an order outside of regulatory testing requirements.
Stack tests are generally conducted by third-party environmental testing contractors who have expertise in stack testing and utilize specialized testing equipment designed to measure specific pollutants. The specifications of testing equipment have been standardized within the EPA-approved testing methods, other approved methods allowed by regulation, or otherwise approved by the state or federal regulatory agency. The testing is performed pursuant to an approved testing protocol and is observed by DHEC staff.
In most cases, specialized probes connected to instruments or samplers are inserted into the stack to direct the gas to instruments for immediate measurement or to collect samples for later analysis.
The testing contractors set up the testing equipment according to the test methods and requirements in the approved test plan and verify the equipment is properly calibrated. Then, these contractors extract stack gasses using methods that depend on pollutant being tested and specific equipment being utilized.
A typical stack test consists of a minimum of three test runs of at least one hour in duration each. The results from each run are then averaged to determine the test result.
Stack test data can be used to:
- Determine compliance with emission limits,
- Verify emissions factors used in models and estimates used for permitting,
- Establish or verify operational ranges of various sensors or devices used to monitor and document the source operation,
- Establish or verify pollution control device efficiency,
- Verify accuracy of continuous emissions monitors required by the process or in permits, and
- Provide a basis for required emissions reporting.
Some sources emit pollutants that do not go through a stack or other emissions point. In that case, stack testing equipment and procedures cannot be used to quantify those emissions. However, other compliance methods, such as visible emissions readings, inspections logs, and record keeping are typically used to determine compliance.
For example, for the New Indy stack tests, some emissions were directed through stacks that were specifically designed and installed to allow measurement of emissions that otherwise would have had to be estimated.
All facilities are required to submit a test protocol or plan to DHEC for approval prior to testing. Technical staff review the plan to ensure the correct test methods and procedures are utilized in accordance with the state or federal requirements, permit conditions or an order. The test plan must be approved before testing begins. The facilities are also required to notify DHEC of test dates so DHEC staff may be present to observe the testing procedures and ensure the plan is being followed.
Most testing can be completed in 1-3 days, but due to their complex nature some tests may take much longer. Factors impacting the time required to conduct testing include the number of sources being tested, the number of sampling locations on those sources, the number of different pollutants being tested, the required test methods and associated analytical and laboratory work, testing and safety procedures, and operating conditions of the plant at the time of the test. Often the reports generated are several hundred pages, so additional time is required to review the test data prior to using it to make any regulatory decisions.
After a report is received, DHEC reviews the data and calculations for accuracy and completeness. The testing program is evaluated for adherence to the test plan including applicable regulations, test methods, and other requirements. If errors or missing data is discovered, the facility and testing contractor is notified of what revisions are required to enable the report review to be completed. Once all concerns have been addressed, a draft report summary is written by the DHEC project manager that includes the information gathered from the testing event. This summary report goes through an internal review process and once approved, it is provided to the facility.
Groundwater
A Phase 1 site assessment is a review of the current and historical uses of property to see if those activities have impacted the soil or groundwater and if those impacts could pose a threat to the environment and/or human health.
A Phase 1 Environmental Site Assessment was conducted as part of the real estate transaction.
Our periodic monitoring assessment reports have indicated localized groundwater impact by petroleum and cleaning solvent constituents, and metals at low concentrations at various locations on the plant property. There is no evidence of contamination leaving the property in groundwater.
Public drinking water in the area comes from the Catawba River at a location upstream from New Indy.
All private wells identified in a well survey are either located:
- on the opposite side of the Catawba river, which serves as a barrier to groundwater flow, or
- or in areas before groundwater flows under the facility
The available data and information do not suggest a potential risk of impact to drinking water sources.
Assessment and Corrective Action
The federal “superfund” program has many facets and authorities. The team EPA sent to help with air monitoring is housed in the superfund program and they acted under the authorities the federal superfund program provides to be able to assist with the air monitoring. New Indy is not a listed federal Superfund site (also known as a National Priority List (NPL) site).
The VCOC provides for Department oversight of the environmental assessment of the property and the subsequent corrective actions taken based on the assessment results. The Department entered into a Voluntary Cleanup Oversight Contract (VCOC) with New-Indy Catawba, LLC, for the Bowater-Catawba Pulp site on December 21, 2018.
The cleanup covered by the VCOC includes the necessary response actions to address dioxin-containing sludge at the site. The subject of this contract is limited in scope and is not related to offsite odors.
The contract is voluntary in the sense that it is not required and can be terminated by New Indy. If they elect to terminate, the company must certify that the site doesn’t pose a new health or environmental hazard that did not exist prior to response actions initiated under the VCOC.
It has not been completed to date and is ongoing.
Any non-compliance with the terms of the VCOC could be cause for termination of the contract in which case any protections afforded therein would be terminated.
The site will continue to be monitored after the VCOC is completed.
The objective of the contract and the process is to ensure that the risk of exposure to the public is minimized. New Indy will be required to prevent any migration of chemicals covered under the VCOC offsite and to clean up any offsite release of contaminants.
No.
Dioxin
No. Current operations are not anticipated to generate Dioxins on site.
Dioxins are a class of chemicals that can form when chlorine comes in contact with organic material. Chlorine or other bleaching chemicals are not used at New Indy because the mill no longer produces bleached paper. Previous owners had discontinued using chlorine which reduced generation of the most toxic dioxin (2,3,7,8 TCDD) in favor of much less toxic dioxin-like compounds.
The dioxin that are currently on the New Indy site are from the historical use of chlorine.
Maximum Contaminant Level Goal is the concentration of a contaminant below which there is no known or expected risk to health. This is a goal and is not enforceable.
For Dioxin (2,3,7,8 Tetrachlorodibenzo-p-dioxin or TCDD), the MCLG has been set at zero because EPA believes this concentration is necessary to provide a level of protection that would not cause any of the potential health problems.
EPA may set an enforceable standard called a Maximum Contaminant Level (MCL). MCLs are set as close as possible to MCLGs as possible, considering the ability of public water systems to detect and remove contaminants using suitable treatment technologies.
The MCL for Dioxin (2,3,7,8 Tetrachlorodibenzo-p-dioxin or TCDD) has been set at .00003 parts per billion(ppb) or 30 picograms per Liter (ppq or parts per quadrillion) because EPA believes, given present technologies and resources, this is the lowest level to which water systems can reasonably be required to remove this contaminant if it should occur in drinking water. A picogram is one trillionth of a gram.
The MCL for Dioxin (2,3,7,8 Tetrachlorodibenzo-p-dioxin or TCDD) is used for evaluation of other “dioxin-like” chemicals using adjustment factors called Toxic Equivalency Factors (TEFs) that account for differences in their toxicities. For example, the TEF for Octachlorodibenzo-p-dioxin (OCDD) is .0003, which means the chemical is considered 3300 times less dangerous than 2,3,7,8-TCDD.
In recent third-party sampling reported for samples collected near New Indy at the Catawba riverbank, none of the samples were described to have contained concentrations of dioxin-like chemicals greater than the MCL for 2,3,7,8 TCDD after TEFs were applied. The maximum result for combined dioxin concentration in water was 2.88 pg/L, more than ten times lower than the Dioxin MCL.
New Indy is required to monitor for dioxin and other contaminants at its site, and that monitoring data is routinely provided to DHEC for additional review. No hazardous level of dioxin or dioxin-like compounds has been detected in any of the permanent monitoring wells at the facility and there have been no detections in the permanent monitoring wells located between the lagoons and the Catawba River.
If a significant change in the concentration of dioxins were to be detected in samples from the permanent perimeter groundwater monitoring wells, DHEC would immediately work with the facility address the potential for offsite migration.
Air Monitoring Data
The offsite (community) and onsite (fence line) monitors operated by EPA, DHEC and New-Indy operate 24 hours a day, 7 days a week. The EPA community monitoring ended June 30 at which time a third-party contractor hired by New-Indy began collecting and reporting data. DHEC also has a monitor in a community, but now is focusing on two sites near the boundary of the mill. Data is posted to our webpage daily.
There may be short periods of time when a monitor will be offline for maintenance, operational checks or repair, but monitors are expected to be operating through the night and over weekends and holidays. If there is a significant period of missing data, it will be indicated in the daily reports.
EPA had evidence that operations at the New Indy Facility were emitting hydrogen sulfide into the air at concentrations measured offsite that, if allowed to continue, posed an imminent and substantial endangerment to public health, welfare or the environment.
Hydrogen sulfide is one of a class of chemicals emitted by Pulp and Paper Mills referred to as Total Reduced Sulfur (TRS) that may create strong odors. The main four chemicals in TRS are:
- Hydrogen sulfide
- Methyl mercaptan
- Dimethyl Sulfide
- Dimethyl Disulfide
The odor reports from citizens since mid-March overwhelmingly describe an odor like rotten eggs, an odor most associated with H2S.
Methyl mercaptan is described as a gas odor because most people associate it with natural gas. Natural gas is odorless. Methyl Mercaptan is added to natural gas to alert people to gas leaks. Gas-like odors have been infrequently reported.
Dimethyl Sulfide and Dimethyl Disulfide may have a cabbage smell.
The DHEC order and EPA Information Request letter required New Indy to perform testing for all four of these TRS pollutants during the Stack Testing.
If you have gas appliances, you have methyl mercaptan (or another chemical odorant) in the gas that is in your home. There is a reminder on our web page that any gas-like odor, especially indoors, should be taken very seriously as it could represent a gas leak that would pose immediate and significant safety concerns to building occupants.
The EPA’s GMAP report compared H2S results to the ATSDR Acute Minimal Risk Level (MRL) of 70 parts per billion. In a footnote on page 2 they say, “MRLs are intended to serve as a screening tool to help public health professionals decide where to look at a pollutant more closely. To be protective and conservative, ATSDR sets MRLs below levels that, based on current information, may cause adverse health effects. Exposure to a level above the MRL does not mean that adverse health effects will occur. Rather, it indicates the need to investigate the situation more closely.”
Exposure guidelines have two components: concentration and time. Both components are part of how safe levels are established to be protective.
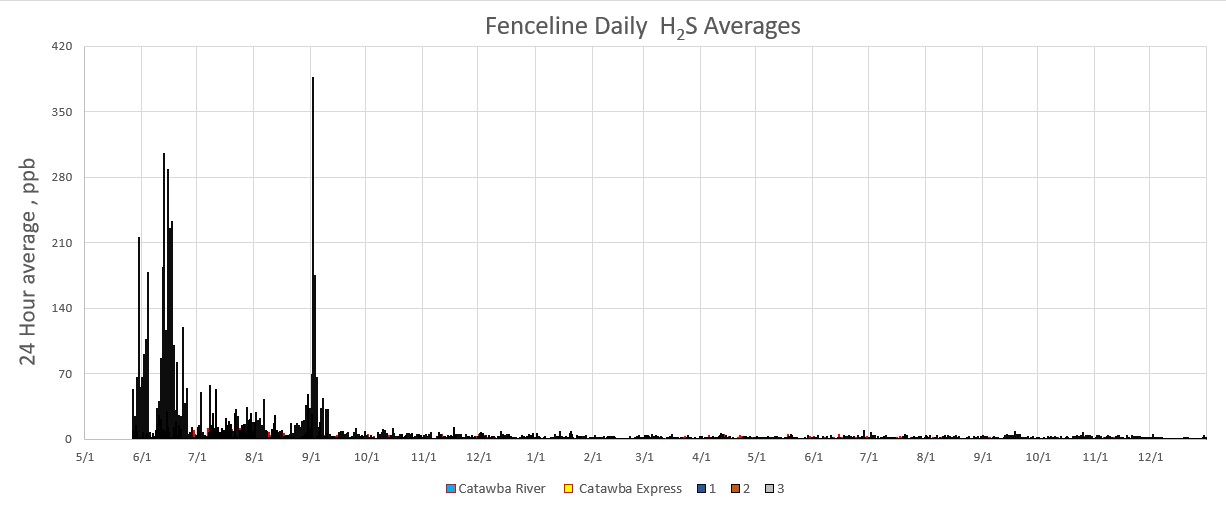
The monitors closest to New Indy have reported concentrations of H2S above the ATSDR Minimal Risk Level (MRL) of 70 ppb. However, in all cases to date, the elevated concentrations have been for short periods and the 24 hour average concentration used for comparison to the level of the MRL has not approached the level of the standard.
The DHEC daily report provides both the rolling 24-hour average and the average for the report period (midnight to midnight). The rolling 24-hour average is calculated continuously and is shown on the daily report graph.
The calculation does not start over each day. For the DHEC daily reports, the average for the period is displayed report table.
There are two types of air monitoring being done – each to meet different but overlapping objectives.
Both onsite (fence line) and community monitoring help ensure that concentrations of H2S are maintained at concentrations that are below established levels of concern.
EPA required New-Indy in their Order and Information Request letters to establish and operate three fence line monitors and a network of community monitors.
EPA operated community monitors from May 13th to June 29th. New-Indy has operated community monitors since June 30th and is required to continue monitoring and reporting for one year.
DHEC has also been operating monitors to supplement the New-Indy fence line sites and collocated with one of the New-Indy community monitors
The Community Monitoring conducted by EPA, New-Indy and DHEC has consistently shown that concentrations are below the level of the ATSDR Acute Minimal Risk Level (MRL) of 70 parts per billion over 24 hours.
Although some concentration peaks have occurred that are above the level of the MRL, they have typically been of short duration and the average exposure has not gotten close to the MRL. There have been no offsite 24-hour average concentrations of H2S detected above 4 ppb since early September 2021.
To be protective and conservative, ATSDR sets MRLs below levels that, based on current information, may cause adverse health effects at that concentration over the indicated period of time. Exposure to a level above the MRL does not mean that adverse health effects will occur. Rather, it indicates the need to investigate the situation more closely.
The onsite, or fence line monitors, often indicate concentrations that are higher than detected by the community monitors. This is expected since they are closer to the sources. That monitoring has indicated a general decrease in concentrations of H2S over time.
The fence line monitors nearest the sources can provide the clearest and most immediate indication of problems and processes that contribute to emissions. Concentrations are higher and, are detected more quickly and can prompt a response that can minimize offsite impact. Analysis of the fence line data can also reveal sources that may not have been considered.
For example, on the evening of June 4th a significant spike in H2S concentration at New-Indy’s station 1 prompted a rapid response, investigation, and identification of an immediate source (post aeration basin), planning and implementation of mitigation (cover and charcoal scrubbing) and planning for a permanent corrective action. The onsite monitoring prompted a rapid response to an unexpected source of emissions, application and evaluation of an immediate corrective action to one emissions point and longer-term response and corrective actions that are reducing emissions from an area (Holding Pond #1) that had not previously been identified as a contributor to emissions.
Ambient air monitoring strategies consider objectives, resources and capabilities. In this case, we are trying to assess the potential risk over an area of more than 300 square miles. The relatively large number of monitors that EPA provided and the ability to have near real time access to the data provided capability and resources that is unprecedented in South Carolina.
Each monitor represents concentrations across a community. There will be areas of higher and lower concentration at any particular moment, but over time a monitor that is placed to have clear air flow will provide a measurement that is representative of concentrations in the area. In general, monitor placement will follow the requirements EPA has established for ambient monitor siting.
The objective of the community monitoring has been to measure representative concentrations where people have reported impacts. The communities and locations were selected based on prevailing and expected wind, concentrations of residents that have provided reports, and the availability of suitable, specific locations within those communities to place monitors.
If the monitoring objective was only to capture highest concentrations, the monitoring network would look very different. The EPA-ordered fence line monitors and some other monitoring EPA and DHEC have conducted serve that and similar objectives.
The community monitoring provides a quantitative indicator of community impact that can be compared to health-based guidance, help identify conditions that may increase the burden and provide a measure of the effectiveness of changes at the source. It is only one point and all individual’s experience will be different, but over the months of data collection we have gained better understanding of the concentration range, duration, and the extent of the impacts.
The ATSDR Acute Minimal Risk Level (MRL) of 70 parts per billion intended to serve as a screening tool to help public health professionals decide where to look at a pollutant more closely. To be protective and conservative, ATSDR sets MRLs below levels that, based on current information, may cause adverse health effects. Exposure to a level above the MRL does not mean that adverse health effects will occur.
The level is set based on exposure to an average concentration at or above the level for 24 hours.
To date, no community monitoring results have approached the 70 ppb ATSDR Minimal Risk Level for 24 hours. There must be significantly higher concentrations detected to exceed other, shorter time period exposure guidelines. For instance, the AEGL-1 for 10 minutes is 750 parts per billion.
Acute Exposure Guideline Levels (AEGLs) represent threshold exposure limits for the general public and are applicable to emergency exposure periods ranging from 10 minutes (min) to 8 hours (h). Three levels—AEGL-1, AEGL-2, and AEGL—are developed for each of five exposure periods (10 and 30 min and 1, 4, and 8 h) and are distinguished by varying degrees of severity of toxic effects. AEGL-1 is the airborne concentration of a substance above which it is predicted that the general population, including susceptible individuals, could experience notable discomfort, irritation, or certain asymptomatic, nonsensory effects. However, the effects are not disabling and are transient and reversible upon cessation of exposure.
DHEC has been in close communication with local public drinking water suppliers to the area. The intake for drinking water systems supplying the neighborhoods in the area is UPSTREAM from the New Indy discharge. The nearest downstream drinking water intake is 9 miles downriver. At this time no issues have been identified that are affecting drinking water quality.
DHEC routinely conducts ambient water quality monitoring on rivers and reservoirs across our state. (See this link for information on our ambient monitoring.) DHEC has worked with the Catawba Riverkeeper to conduct a special study on the river, looking at upstream and downstream locations relevant to New Indy. A report has been issued and is posted here.
On-site inspections of the facility by either DHEC or EPA will follow the normal inspection processes for each agency. The processes include on-site visits, reviews of documentation, notices of alleged violations, enforcement conferences, reports, and appeal processes. Once finalized, any enforcement actions will be publicly available and linked from the New Indy Reports & Documents webpage.